Who’s To Blame?
Written by Boston Biker on Aug 31Most bike crashes do not involve car-bike interaction. Most bike crashes (90%) are caused by bicyclists crashing into stationary objects (parked cars, pot holes, curbs, etc), and other non-car related things (other cyclists, pedestrians, animals). The vast majority of these crashes go unreported, because they are either minor injuries, or they simply have no one else to hold legally accountable so they don’t end up with a police report.
A new study from Toronto show’s that of the 10% of crashes that do involve motorist-cyclist interaction a whopping 90% are because of motorists. (the following was stolen without permission from this amazing website, please forgive me!)
What are the Dangers in Terms of Cycling Safety?
- Accident rates per kilometer are 26 to 48 times higher for bikes than for automobiles (13).
- Nearly 44,000 cyclists have died in traffic crashes in the United States since 1932 (the first year in which estimates of cyclist fatalities were recorded) (14).
- U.S. cyclists are three times more likely to be killed than German cyclists and six times more than Dutch cyclists, whether compared per-trip or per-distance traveled (7).
- According the British Medical Journal, the most important deterrent to riding bikes expressed by non-cyclists is fear of motor traffic (15).
- While motorists often accuse cyclists of being the cause of bike-car accidents, a Toronto analysis of 2572 police collision reports (Table 1) demonstrates that this is actually not the case. The most common type of crash in this study involved a motorist entering an intersection controlled by a stop sign or red light, and either failing to stop properly, or proceeding before it was safe to do so. The second most common crash type involved a motorist overtaking unsafely. The third most common type of crash is a motorist opening a door onto an oncoming cyclist. In fact, cyclists are the cause of less than 10% of bike-car accidents in this study (1).
Table 1: Most Frequent Crash Types
Crash Type Number of Cases Relative Frequency Drive Out at Controlled Intersection 284 12.20% Motorist Overtakign 277 11.90% Motorist Opens Door in front of Bicyclist 276 11.90% Motorist Left Turn – Facing Bicyclist 248 10.70% Motorist Right Turn – Other 224 9.60% Motorist Right Turn at Red Light 179 7.70% Drive Out from Lane or Driveway 179 7.70% Ride Out At Controlled Intersection 73 3.10% Wrong Way Bicyclist 59 2.50% Ride Out At Mid-block 51 2.20% From: Tomlinson, David. Conflicts Between Cyclists and Motorists in Toronto, Canada (1).
- Data from Canada suggests that provinces that have invested the most in cycling tend to have the highest rates of cycling and also the lowest rates cycling mortality. Quebec has invested more than any other province on cycling (5). For the period 1987 to 2000, the total number of bicycles in Quebec more than doubled, and the number of regular cyclists increased by 50%, while cycling fatalities fell by 42%, serious injuries fell by 56%, and minor injuries fell by 38% (5).
- Data from Europe (Figures 1and 2) also suggests that counties that have invested the most in cycling tend to have the highest rates of cycling and also the lowest rates cycling mortality (6).
Figure 1: Cycling risk versus cycling intensity in European countries
Risk of cycling tends to be lowest in the countries with the most cycling (6)
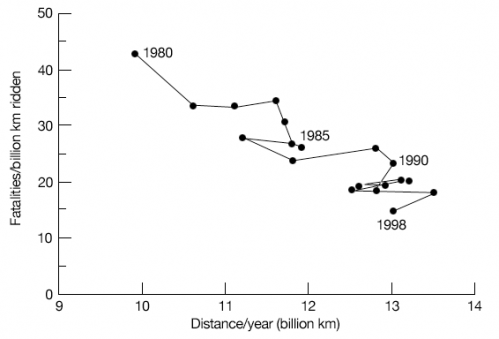
Figure 2: Bicycling in Netherlands 1980-1998
A 30% increase in cycle traffic is associated with a two-third reduction in risk, e.g. a decrease of the total number of fatal cycling accidents (6).
As levels of pedestrian and bicyclist activity rise their per capita risk falls. Drivers adapt their behavior in the presence of increased cycling and walking (17).
I highly suggest you go read the rest of this website, as it is very well put together and very convincing.
Tags: bike crashes, blame, science, survey, toronto
Posted in advocacy | 5 Comments »
5 Responses
to “Who’s To Blame?”
Sorry, comments for this entry are closed at this time.


By cyclostat on Aug 31, 2009 | Reply
This website is giving me a stats boner. Thanks for the post! It’s been tough finding legit sources of bicycling statistics. It seems like very few organizations are keeping track.
By Bike Lane Contrarian on Sep 4, 2009 | Reply
This safety-in-numbers argument is gaining traction, and the graphs that purport to demonstrate it are widely displayed. Unfortunately, it’s also an example of how junk science is misused to sway popular opinion.
First it was claimed that bike facilities created safety. Research didn’t bear this out, however. The legitimate bicycle studies — as opposed to advocacy research that assumes the correctness of its conclusion a priori — found no significant safety benefits from most bicycle riding facilities.
Now the facilities wonks have another argument: if you build it, they will come — and when they do we will all be safer!
Unfortunately, none of the problems identified with bicycle riding facilities, and in particular, bike lanes and sidepaths are refuted by the FW’s new argument. Instead, they tell us that if we get more cyclists, the numbers show that we also get fewer bike crashes.
I’ve created a Microsoft Excel 2000 spreadsheet that you can download at http://drop.io/JacobsenFallacy . (The name has to do with a researcher who claims that a true correlation exists. He’s wrong.) This spreadsheet creates 100 different, random values for each of these fields: the population of a given area; the number of cyclists in that population; the number of bicycle crashes in that population; and, the average distance ridden by each cyclist each day.
The random data are plotted on a graph that’s similar to the ones shown in this blog page. Bike crashes are on the Y axis, and cyclist miles on the X. In every case, **the same declining power curve appears**, that shows that for high Y-axis values, there will be low X-axis values, and vice versa.
In other words, the same purported decline in crashes per 100,000 Km of cycling (or whatever base distance measure is used) **appears when purely random data are supplied**.
Because random data produce the same declining curve, no correlation between any data producing this curve can be assumed. Please, download this spreadsheet and refresh the data. You’ll see the same declining curve appear again and again.
This non-correlation shouldn’t be so surprising. If real safety can be achieved by increasing the population size, then we should improve airline safety by launching more planes; we can improve traffic safety by driving more cars; and so on.
Well, it doesn’t work that way for planes or cars, and there’s nothing in these numbers that suggest it works that way for bicycling, either.
By Boston Biker on Sep 4, 2009 | Reply
I have neither the time nor the statistical knowledge to argue your points, so lets just assume you are correct. Lets assume that all the many studies done that show a correlation are false, and that you are right.
Even given that there is no safety benefit to having more cyclists on the road, there are still social ones. More bikes on the road means less cars on the road. This means healthier citizens, less pollution, less global warming, and less mortality from things like asthma, heart attacks, and climate change related weather events. Which would seem to me to make everyone safer. I stick to my guns, more bikes = more safety. If you are right it might not be safety in the form of bike crashes, but it does make us safer and healthier.
Plus it’s a lot of fun.
By Bike Lane Contrarian on Sep 4, 2009 | Reply
Thank you for conceding your argument … in a way. Yes, you did assumed I’m correct — less than a ringing endorsement, but that’s okay.
You claim it’s because of some “statistical knowledge” you lack that keeps you from understanding what I’m explaining. Did you look at that spreadsheet? It’s pretty simple. My belief is that, if you’re intelligent enough to understand the graphs that you posted (and I am certain that you are), then you’re also intelligent enough to understand that the spreadsheet that uses garbage data will produce the same conclusion as your graphs indicate.
So — the graphs are worthless, we must agree. The noise is just too loud to hear the song.
Now you have a different argument: that we must have bike lanes to get more cyclists, because more cyclists produce less motor traffic and a whole bunch of other goodies.
Unfortunately, that relationship between bike lanes and goodies has not been true in any industrialized country I’m familiar with. Any country that has had the opportunity to motorize has done so. India and China are the latest countries to have substantial modal shifts from bicycles to motor vehicles, but their conversion followed a pattern that was first seen in the USA after 1900.
It’s true that some European countries have created modal shifts back towards bicycling. But facilities are only a small part of what these nations use to put their citizens back onto their bicycles. The primary way that European countries have gained cyclists is by making other transportation choices prohibitively expensive, or too infrequent or too dangerous to use.
Denmark, for example, charges a 200% sales tax on new cars. A friend of mine, who bought a Mazda 6 for $19,500 in Massachusetts, found the same car on sale in Denmark for $60,000 (its equivalent in euro). When I was in Ireland last year, gasoline was pushing $8 per gallon, and a new Ford Focus, that might run you $16,000 in the USA went for euro 24K — that’s about $39,000! (Even so, Ireland has largely dumped the bike for the car since the 1980s, even as facilities and lanes are popping up everywhere.)
Insurance requirements are also significantly higher in Europe, and city center traffic jams are amazing, by American standards. You haven’t seen a real traffic jam until you’ve seen one in an old, narrow-road European city!
These factors, more than bicycle riding facilities, have influenced people in some European countries to shift to bicycling for certain kinds of trips. People vote with their time and with their pocketbooks, and when a trip by car can’t be made conveniently and at reasonable cost, people will seek other ways of going. If the bicycle is practical by these standards, then many people will choose to bike.
If America is going to make a real modal shift towards bicycling, it’s going to need a lot more than stripes in the gutter lane. And sure, cycling is great exercise, but the person who drives her SUV to the Fitness Now health club gets just as healthy as the cyclist who rides to work. Compare the numbers of people who frequent health clubs each day, year round, and you’ll discover that a lot more people get fit there than by riding their bicycles. It’s going to take more than stripes to change their minds.
Barring a total shift in America’s transportation priorities (a shift that I don’t see anywhere on the horizon, yet has been promised since the 1970s), cyclists are not going to be particularly influential in reducing pollution, limiting climate change, and so on.
Cyclists’ health will be better than sedentary, it’s true, but you don’t need to ride a bike to be fit.
So bike lanes can’t be held up as safety tools, any more than a treadmill can. They also don’t increase traffic safety, and the only data that’s been introduced to support them has been shown to be invalid.
It is a wonder their promoters work so hard to defend them. (But they do!)
By Boston Biker on Sep 4, 2009 | Reply
so you just don’t like bike lanes? I see.